PowerPoint has no native bullet chart type. Here's the combo-chart build for KPI-vs-target rows, plus exactly what breaks when you add or remove a row.
A monthly ops review needs eight KPI rows — revenue, CSAT, utilization, headcount, NPS, churn, pipeline coverage, on-time delivery — each shown against its target in a single glance, without eight separate gauge dials eating the slide. Open PowerPoint's chart gallery looking for the obvious answer and there isn't one: no "bullet chart," no "bullet graph," not in the ribbon and not under Insert > Chart > All Charts. The chart Stephen Few designed in 2005 specifically to replace dashboard gauges has to be built by hand in PowerPoint, out of a combo bar chart with three overlapping layers — a background range, a thin actual-value bar, and a target tick. The layer that breaks first isn't the colors; it's the row-position numbers, the moment you add or delete a KPI. Here's the build, and the specific fix for that breakage.
Why a Gauge Dial Isn't the Answer Here
Few designed the bullet graph as a direct replacement for the circular gauge that shows up on so many executive dashboards, and published the Bullet Graph Design Specification in 2006 (last revised 2013) so chart tools could build it consistently. His complaint about gauges was simple: a dial burns a full circle of slide real estate to show one number against one range, and a page of eight KPIs needs eight dials stacked like a car's instrument cluster. A bullet graph compresses the same information — one measure, one target, and a qualitative sense of what counts as poor, satisfactory, or good — into a single thin horizontal bar. Stack eight of those and they still fit in less space than two gauges, because the chart was built to repeat down a page, not to stand alone.
Three components make up each row: a background made of two or three shaded range segments (poor/satisfactory/good, usually gray shades running from darker for "poor" to lighter for "good"), a single thin bar showing the actual measure, and a perpendicular tick mark showing the target. None of those three is a chart type PowerPoint ships with — which is exactly why every tutorial on this topic, in English or Japanese, converges on the same workaround: a combo chart assembled from ordinary bar and scatter series that aren't built to do this, pushed into position with gap width and axis settings.
The Three-Layer Build, Step by Step
This assumes a data table with one row per KPI and these columns: Name, Poor (upper threshold), Satisfactory (upper threshold), Good (upper threshold, usually your scale's max), Target, Actual.
- Convert the thresholds to stacking segments. A stacked bar needs incremental widths, not the cumulative thresholds you'll actually think in. Add three helper columns:
Seg1 = Poor,Seg2 = Satisfactory − Poor,Seg3 = Good − Satisfactory. Skipping this and feeding the raw cumulative numbers into a stacked bar is the single most common first mistake — it draws the "good" segment three times too wide, because a stacked chart adds every series instead of treating them as thresholds. - Insert a horizontal Stacked Bar chart from Name, Seg1, Seg2, Seg3. Color Seg1 the darkest gray, Seg3 the lightest — reversed from what feels intuitive, since the convention (and Few's own spec) runs darker-for-worse, lighter-for-better, so the eye reads "good" as the open, airy end of the bar. Set Gap Width to roughly 40–60% so the rows sit close together without touching.
- Add Actual as a new series, but change its chart type to Bar on a Secondary Axis rather than stacking it into the same series group. Right-click the chart, choose Change Series Chart Type, set Actual to Bar, and check Secondary Axis. On that secondary axis, push Gap Width much higher — around 300% — which is what narrows the bar enough to read as a thin measure line sitting inside the wider range bar rather than another full-width segment.
- Force the secondary axis's minimum and maximum to match the primary axis exactly (for example, both set to 0–100, or 0 to whatever the largest Good threshold is across all rows). Leave either on Auto and Excel will rescale the secondary axis to the Actual series' own min/max, which quietly breaks the 1:1 correspondence between the two bars — a 72% actual value will render past the 80% mark on the range behind it, because the two axes are no longer measuring the same scale.
- Build the target tick as an XY Scatter series with Y-error bars — not a fourth bar. A bar, however thin, still has width and reads as another segment, not a mark. Add a scatter series where X = each row's Target value and Y = that row's position number (1 for the first KPI, 2 for the second, and so on), plotted on the secondary axis. Convert it to error bars: add a Y error bar, fixed value around 0.3–0.4, no end caps, then delete the point marker itself in Format Data Point so only the vertical tick remains.
- Strip the chart down. Delete the legend, delete gridlines, and remove the category axis labels if your row labels are already handled by a text box running down the left side. Add one small text-box legend once, off to the side, rather than repeating "Poor / Satisfactory / Good" next to every row.
Common failure here: the Y-position column from step 5 is the one piece of the whole build that's hand-typed rather than calculated from your actual data, and it's the part every public tutorial on this chart skips past in one line — which is also exactly the part covered in the next section, because it's where a working bullet chart quietly stops working the first time your KPI list changes.
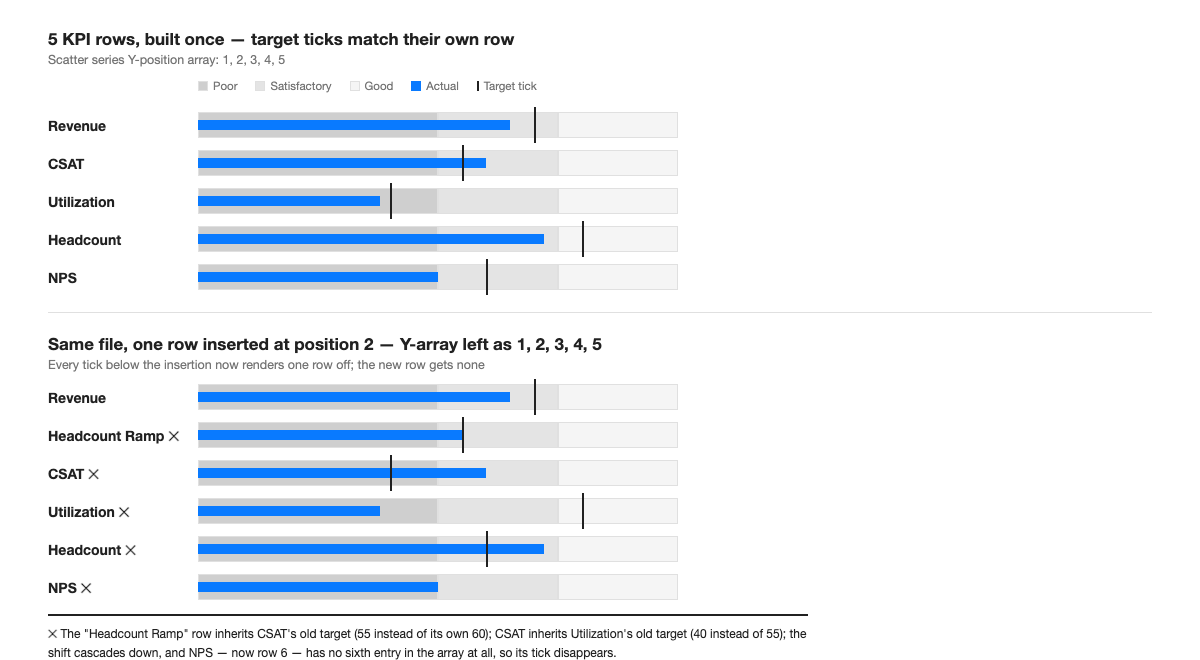
What Actually Breaks When a KPI Row Gets Added or Removed
The figure above is the failure mode that makes this chart feel fragile in practice, and it comes from step 5 specifically. The scatter series' Y column isn't a formula that reads "whatever row I'm currently in" — it's a flat list of numbers you typed once: 1, 2, 3, 4, 5. Insert a new KPI as row 2, and every row from there down physically moves — but that Y column doesn't know that. Row 3's old position (3) is still sitting in a cell that now corresponds to a different KPI, so its tick lands on whatever row happens to occupy position 3 now, not on the row it was actually meant for. The new row you just inserted, meanwhile, gets no tick at all, because there's no sixth number in a column that only ever had five.
This is different from — and easy to confuse with — the axis mismatch problem from step 4. If a newly added KPI uses a wider scale than the rest (say, a headcount row running 0–500 while everything else runs 0–100), the shared primary/secondary axis stops being valid for every row, not just the new one, because a bullet chart built this way only has one horizontal scale for the whole chart. The fix there is different: either rescale every row's thresholds onto a common 0–100 index before charting (percent-of-target is the usual choice), or give that one KPI its own small bullet chart rather than forcing it into the shared axis.
The practical fix for the Y-position problem is mechanical but non-negotiable: every time a row is added, removed, or reordered, retype the entire Y column from 1 to N, top to bottom, rather than patching the one cell that looks wrong. Patching individual cells is how the error compounds — a half-fixed array looks correct for three rows and wrong for two, which is far harder to spot in a quick review than a chart where every tick is off by the same amount.
Worked Example: A Regional Ops Review With Seven KPIs
A regional ops lead needed one slide covering revenue, CSAT, utilization, a new headcount ramp, NPS, churn, and pipeline coverage — seven rows, all reporting the same week. Revenue came in at 76% of target; CSAT hit 91 against an 85 target; utilization sat at 68 against a 75 target; the headcount ramp was at 55 of 60 hires; NPS landed at 42 against a 50 target; churn ran 3.1% against a 2.5% target; pipeline coverage was 2.1x against a 2.0x target.
Churn is the row that exposes a detail none of the six other rows need: it's an inverse metric, where lower is better. Built with the same gray-darker-for-poor, lighter-for-good convention as every other row, a 3.1% churn reading against a 2.5% target would show a bar sitting inside the "good" (light) segment purely because 3.1 is a larger number than 2.5 — exactly backward from what the row is supposed to communicate. The fix isn't a different chart mechanism, just a reversed range order for that one row: Good threshold lowest, Poor threshold highest, so the shaded background runs dark-to-light in the opposite direction from the rest of the slide. Label it, too — a single small caption under an inverse-metric row ("lower is better") costs one line and prevents the one genuinely common misread in a mixed KPI pack.
Field note: the first version of this slide, built during a monthly business review cycle at a global consulting firm, had the churn row using the same range direction as revenue — technically correct data, built backward. Nobody caught it until a VP asked why churn "looked good" in a month the number had actually gotten worse. Flipping one row's threshold order fixed it in under a minute; the harder part was noticing it needed fixing at all, since the chart renders without any error regardless of which direction the ranges run.
Three Failures Worth Checking Before You Present
- Secondary axis drift. If anyone widened a range threshold after the chart was built — a new "Good" ceiling, a rescaled target — check that the secondary axis min/max still matches the primary axis exactly. A mismatch doesn't throw an error; it just quietly misscales every actual bar against the background behind it.
- Unrenumbered target positions. After any row insertion, deletion, or reorder, confirm the scatter series' Y-position column reads 1 through N in the current row order, not the order it was built in. This is the failure from the section above, and it's invisible at a glance — every tick still renders, just on the wrong row.
- Inverse KPIs sharing the wrong range direction. Any metric where lower is better — churn, cost, cycle time, error rate — needs its Poor/Good threshold order reversed relative to the rest of the chart, or a reader's eye will read "light background, so it's fine" on a row that's actually missing its target.
There's also a scale limit worth naming honestly: the whole point of a bullet chart is that it packs more KPIs into less space than a gauge, but that advantage has a ceiling. Past roughly fifteen to twenty rows on one chart, the Y-position array gets long enough that a single transposed digit is nearly impossible to spot in a quick scan, and the chart itself gets tall enough that it stops reading as "one glance." At that point, the fix isn't to abandon the format — it's to split one long bullet chart into two or three shorter ones grouped by function (growth metrics, operational metrics, people metrics), each with its own short Y-array that's actually checkable in a few seconds. A bullet chart that's hard to audit at a glance has lost the one property that made it worth building over a gauge in the first place.
Most teams that keep a KPI pack like this one live in a balanced scorecard cadence, refreshed every review cycle with a different set of rows each time — which is precisely the situation where a hand-built Y-position array becomes a recurring liability rather than a one-time setup cost. That's the specific gap Advisio closes: feed it a KPI's name, range thresholds, target, and actual, and it rebuilds the stacked range, secondary-axis measure bar, and target tick from scratch every time a row is added or removed, rather than leaving a stale position number sitting in a scatter series until someone in the room notices a tick in the wrong place.
PowerPoint not shipping a native bullet chart was never really the hard part — the workaround has been public for years. What the public tutorials skip is the part that actually costs time in a real reporting cycle: the single hand-typed array that has to be rebuilt, in full, every time the row count changes. Get that one habit right and the rest of the build holds. For a different chart PowerPoint also doesn't ship natively, built from an entirely different combo-chart trick, see the dumbbell chart walkthrough.